MCP Apps: Building Interactive UIs for AI Agents

In this tutorial, you'll learn how to build rich, interactive user interfaces that AI agents can display directly in their chat interfaces. We'll explore the MCP Apps protocol and build two progressively sophisticated examples—from a simple greeting card to a real-time Bitcoin dashboard with live charts.
> 📝 Note: This tutorial is based on the MCP Apps Proposal (SEP-1865).
What is MCP Apps?
MCP Apps extends the Model Context Protocol (MCP) to allow servers to return not just text or JSON, but complete user interfaces.
Imagine asking an AI assistant "What's the Bitcoin price?". A traditional MCP server might return a plain text response like "$45,234". But with MCP Apps, the server can return a beautifully designed dashboard with:
- Real-time price charts
- 24-hour high/low indicators
- Trading volume statistics
- Market cap information
All rendered directly in your AI client—whether that's Goose, Claude Desktop, or any other MCP-compatible application.
Getting Started: Project Setup
Before we dive into building MCP Apps, let's set up our project from scratch.
Create Project Directory
# Create and enter the project directory
mkdir mcp-app-demo
cd mcp-app-demo
Initialize Project with uv
We'll use uv, a fast Python package manager, to manage our dependencies.
# Initialize a new Python project
uv init

# Add required dependencies
uv add mcp-ui-server fastapi fastmcp httpx
This will install:
mcp-ui-server- Helper library for creating UI resourcesfastapi- Web framework for serving HTMLfastmcp- FastMCP framework for building MCP servershttpx- HTTP client for making API requests
Your project is now ready! You should see a pyproject.toml file and a uv.lock file in your directory.
Example 1: Welcome Card (Inline HTML)
Let's start with the simplest possible MCP App—a greeting card. This example demonstrates the fundamental concepts using inline HTML directly in Python.
Key Concepts
- HTTP Stream Transport: We'll run our server on HTTP (port 8031) rather than stdio, making it easy to test and debug
- rawHtml Mode: HTML code is embedded directly in the Python string
- FastMCP: A Python framework that simplifies MCP server development
Complete Code
Create a file called demo-app-1.py:
from mcp.server.fastmcp import FastMCP
from mcp_ui_server import create_ui_resource
from mcp_ui_server.core import UIResource


# Initialize the server
mcp = FastMCP("demo-simple", port=8031)


@mcp.tool()
def greet() -> list[UIResource]:
    """A simple greeting tool that returns a UI resource."""
    ui_resource = create_ui_resource(
        {
            "uri": "ui://greeting/simple",
            "content": {
                "type": "rawHtml",
                "htmlString": """
                <div style="padding: 20px; text-align: center; font-family: Arial, sans-serif;">
                    <h1 style="color: #2563eb;">Hello from Python MCP Server!</h1>
                    <p>This UI resource was generated server-side using mcp-ui-server.</p>
                </div>
            """,
            },
            "encoding": "text",
        }
    )
    return [ui_resource]


if __name__ == "__main__":
    mcp.run(transport="streamable-http")
Code Walkthrough
Let's break down the key components:
1. Import Dependenciesfrom mcp.server.fastmcp import FastMCP from mcp_ui_server import create_ui_resource from mcp_ui_server.core import UIResource
FastMCP: The main framework for building MCP serverscreate_ui_resource: Helper function to create UI resources with proper metadataUIResource: Type hint for the return value
mcp = FastMCP("demo-simple", port=8031)
- First argument: server name (must be unique)
port=8031: HTTP port for the server
@mcp.tool()
def greet() -> list[UIResource]:
    """A simple greeting tool that returns a UI resource."""
- The
@mcp.tool()decorator exposes this function as an MCP tool - Returns a list of
UIResourceobjects - The docstring becomes the tool's description for AI agents
ui_resource = create_ui_resource({
    "uri": "ui://greeting/simple",
    "content": {
        "type": "rawHtml",
        "htmlString": "..."
    },
    "encoding": "text"
})
uri: Unique identifier for this UI resourcetype: "rawHtml": Tells the client to render inline HTMLhtmlString: The actual HTML contentencoding: "text": Text encoding format
mcp.run(transport="streamable-http")
streamable-http: HTTP-based transport (vs stdio)- Makes the server accessible via web requests
When to Use Inline HTML
The rawHtml mode is ideal for:
- Quick prototypes and proofs of concept
- Simple static content (notices, confirmations)
- UI that doesn't need external assets
- Learning and experimentation
For production applications with complex styling and JavaScript libraries, you'll want to use the iframe mode shown in Example 2.
Using Goose Desktop to Call Your MCP Server
Now that we have a working MCP server, let's connect it to Goose Desktop—an AI agent with native MCP-UI support. Goose Desktop will be able to call our greet tool and render the UI directly in its interface.
What is Goose Desktop?
Goose Desktop is an AI-powered developer assistant with a desktop application interface. Unlike text-only AI assistants, Goose Desktop has native support for rendering MCP-UI components, making it perfect for testing our MCP Apps.Step 1: Install Goose Desktop
Download and install Goose Desktop from the official website.
Step 2: Start Your MCP Server
In one terminal, start your first example:
# Run the server (uv will handle dependencies automatically)
uv run demo-app-1.py
You should see output indicating the server is running on port 8031.
Step 3: Configure Goose Desktop
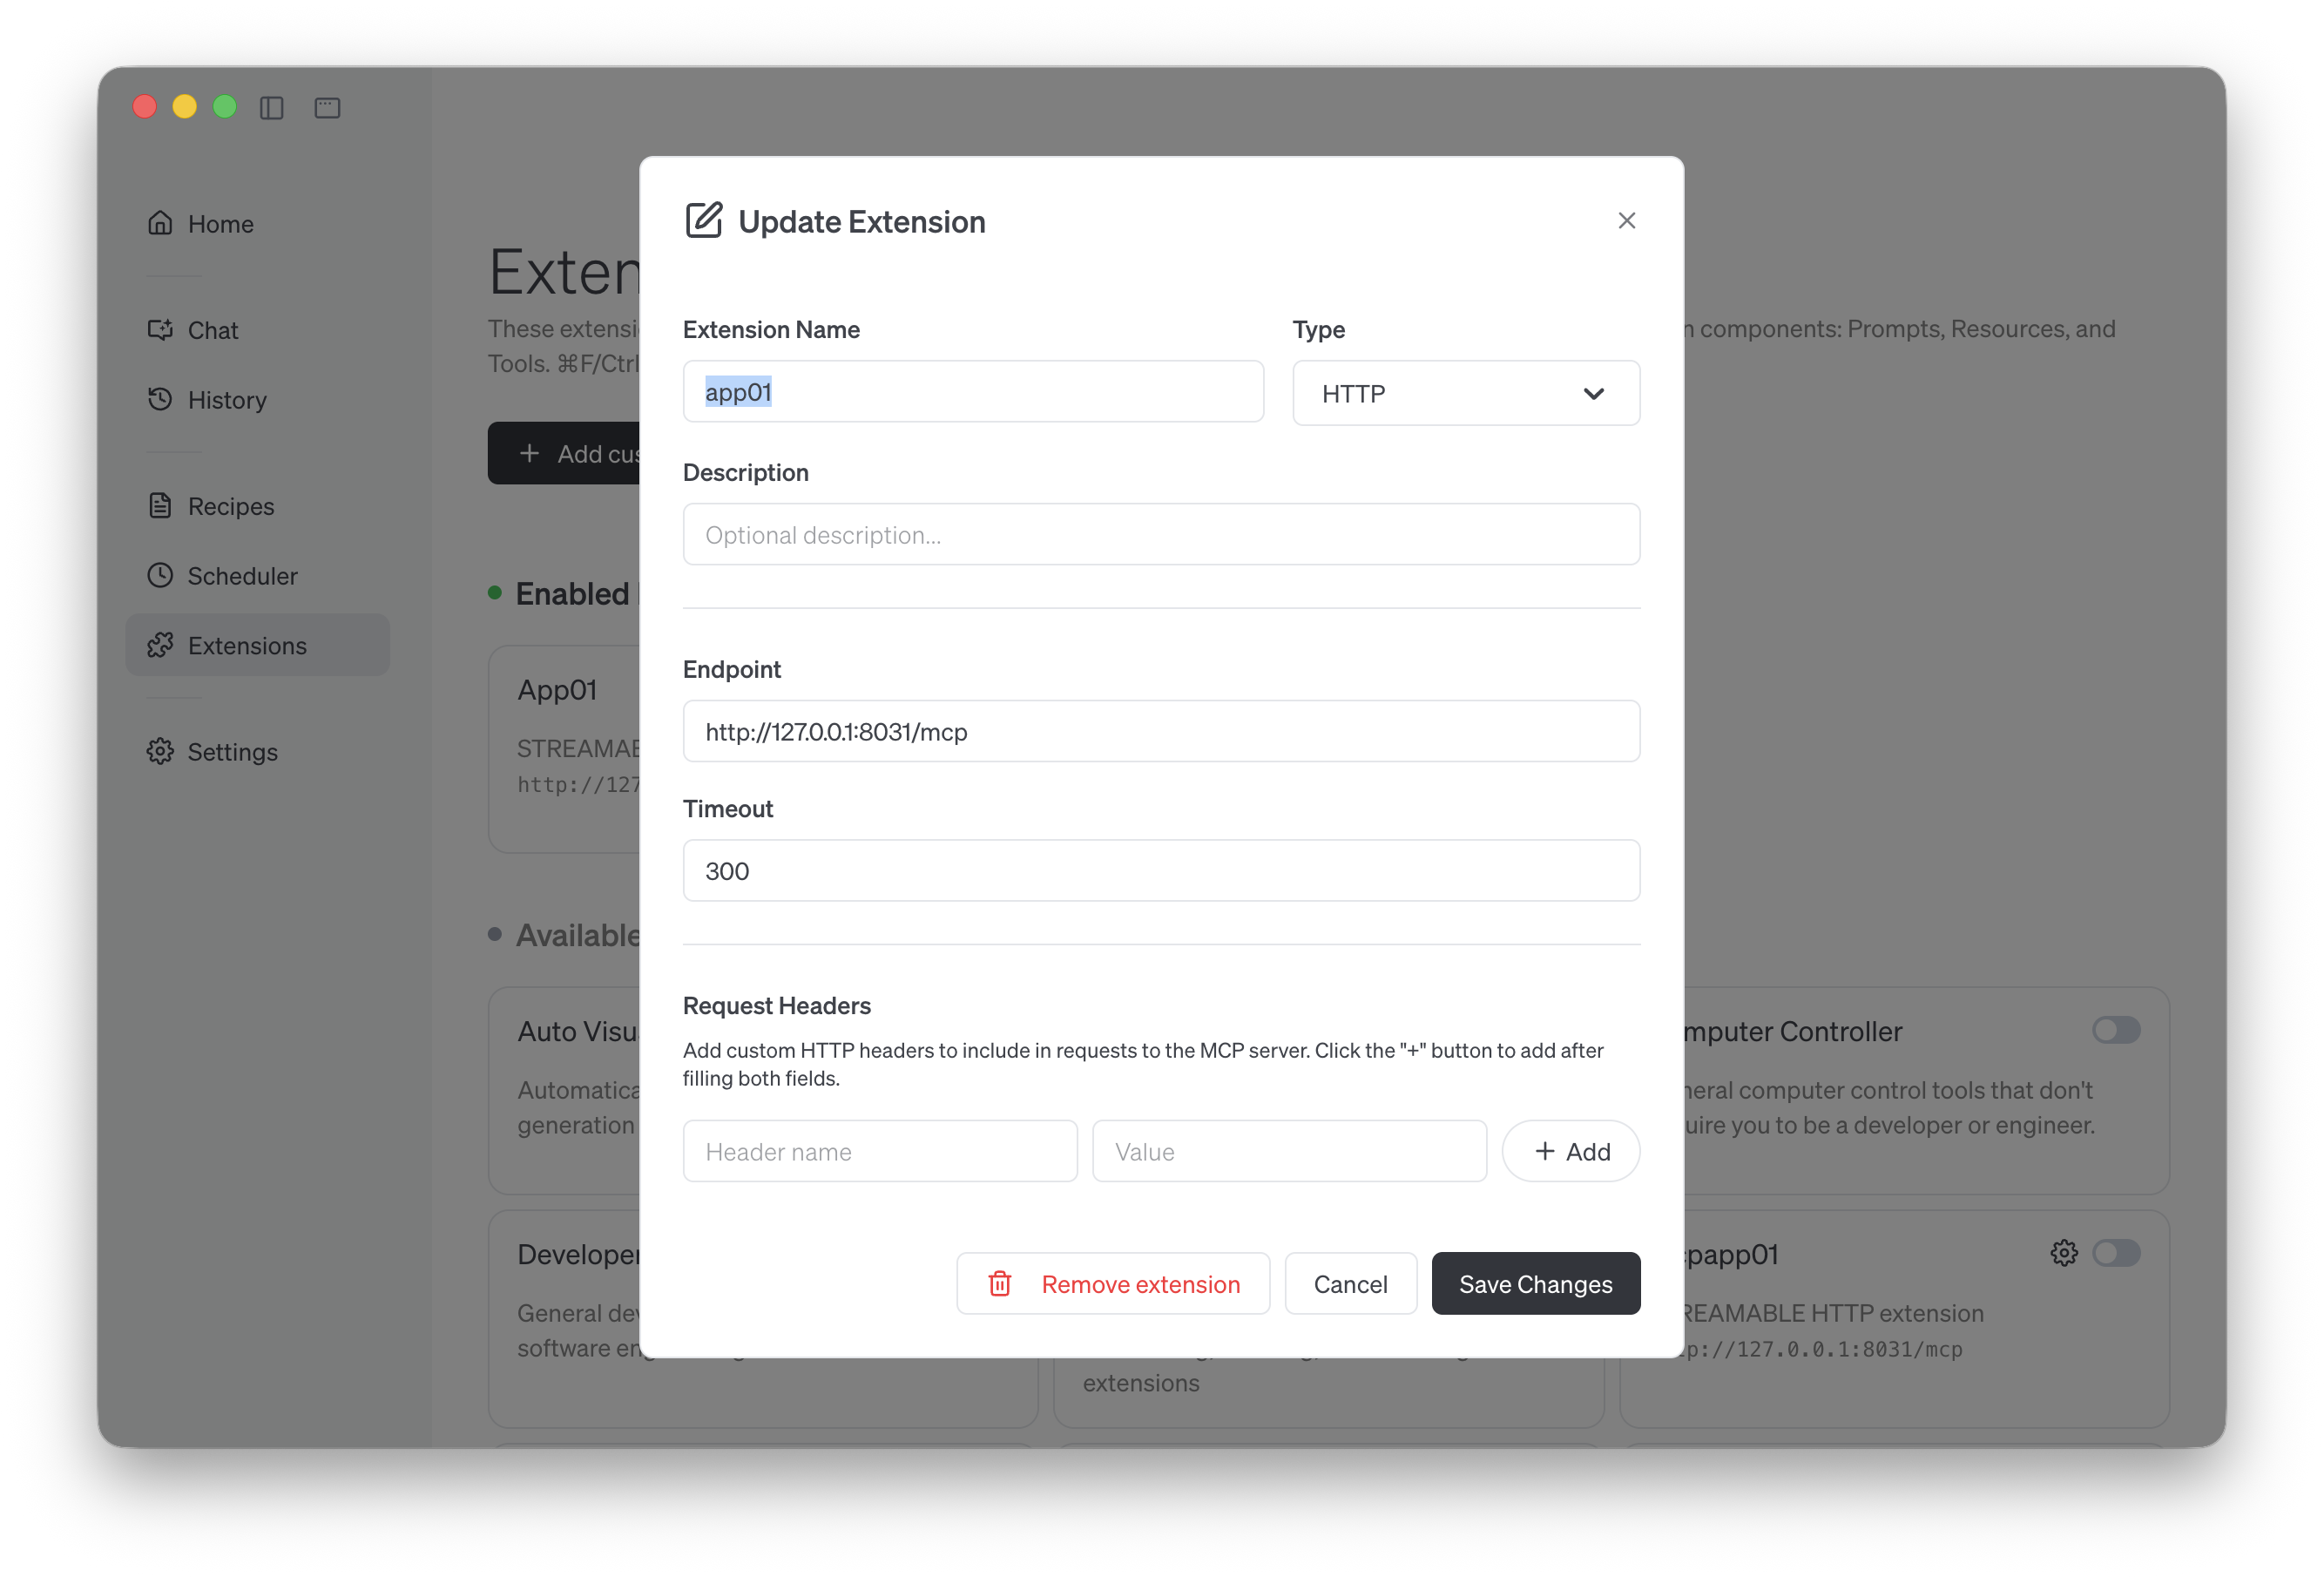
You can connect the MCP server using Goose Desktop's Extensions section:
- Open Goose Desktop
- Navigate to Extensions
- Add a new MCP server with the following settings:
- Name:
app01(or any friendly name) - Type: HTTP
- Endpoint:
http://127.0.0.1:8031/mcp
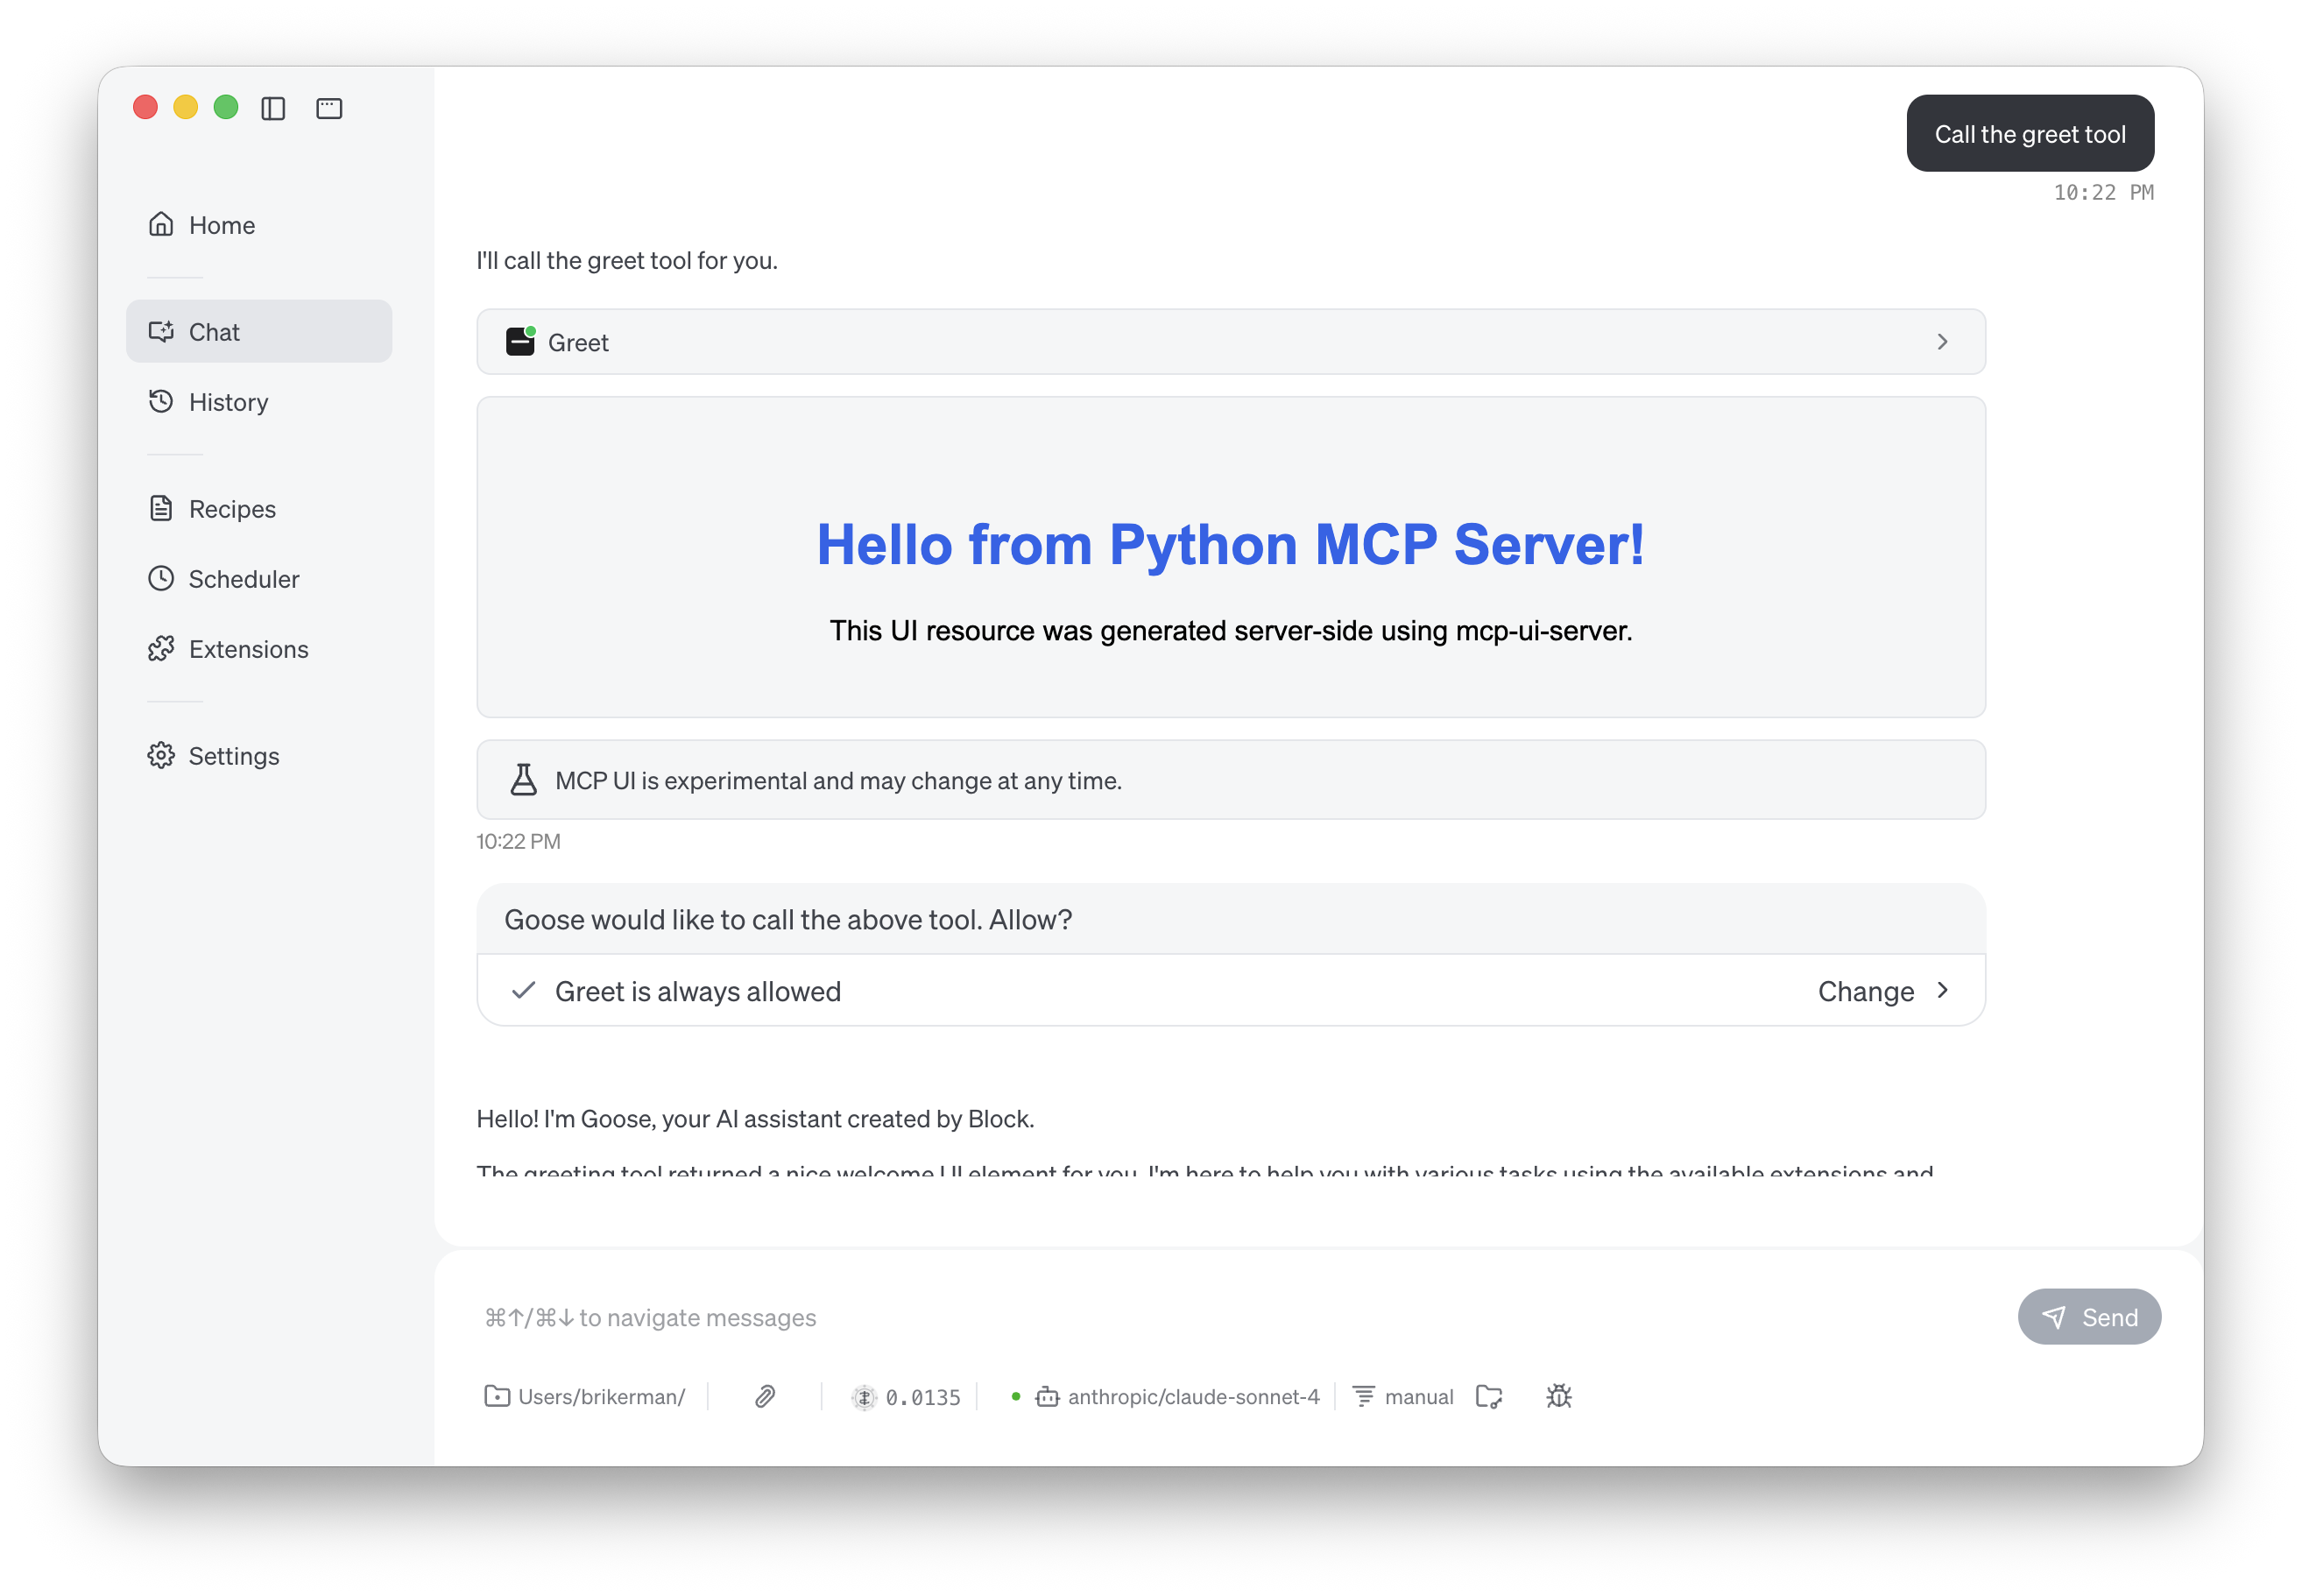
Step 4: Test with Goose Desktop
Open Goose Desktop and start a new session.
Now ask Goose Desktop to call your tool: Call the greet tool
Troubleshooting
If Goose Desktop can't connect to your server:
- Check server is running: Visit
http://localhost:8031in your browser - Check logs: Look at server output for error messages
- Restart Goose Desktop: After modifying extensions, restart Goose Desktop
Example 2: Bitcoin Dashboard (Rich UI + iframe Mode)
Now let's build something more sophisticated: a real-time Bitcoin price dashboard with charts and statistics. This example showcases the full power of MCP Apps by integrating:
- Tailwind CSS for modern styling
- Chart.js for interactive visualizations
- CoinGecko API for real-time cryptocurrency data
- iframe rendering for proper JavaScript execution
Why iframe Mode?
Unlike Example 1's inline HTML, the iframe mode offers several advantages:
- Separation of Concerns: HTML lives in a separate file, not in Python strings
- IDE Support: Full syntax highlighting and autocomplete for HTML/CSS/JS
- Real Browser Environment: JavaScript libraries like Chart.js work perfectly
- No CDN Issues: External scripts can load and execute normally
Architecture Overview
Example 2 uses a dual-server architecture where FastMCP and FastAPI run together:
┌─────────────────────────────────────┐
│  Single Python Process (port 8032)  │
│                                     │
│  ┌──────────────────────────────┐   │
│  │ FastAPI Application          │   │
│  │                              │   │
│  │ ├─ /mcp (FastMCP mounted)    │   │
│  │ │  └─ show_bitcoin_price()   │   │
│  │ │     Returns: iframe URL    │   │
│  │ │                            │   │
│  │ └─ /ui/bitcoin               │   │
│  │    Renders: HTML + data      │   │
│  └──────────────────────────────┘   │
└─────────────────────────────────────┘
When an AI agent calls show_bitcoin_price(), it receives an iframe URL pointing to /ui/bitcoin, which renders the dashboard with real-time data.
Complete Server Code
Create demo-app-2.py:
from fastmcp import FastMCP
from mcp_ui_server import create_ui_resource
from mcp_ui_server.core import UIResource
from fastapi import FastAPI
from fastapi.responses import HTMLResponse
from string import Template
import random
import os
import uvicorn
import httpx
from datetime import datetime

# Initialize FastMCP
mcp = FastMCP("demo-bitcoin")

def load_html_template() -> str:
    """Load the external HTML template file."""
    current_dir = os.path.dirname(os.path.abspath(__file__))
    file_path = os.path.join(current_dir, "bitcoin-ui.html")
    with open(file_path, "r", encoding="utf-8") as f:
        return f.read()

async def fetch_bitcoin_data(currency: str = "USD"):
    """Fetch real Bitcoin data from CoinGecko API (free, no API key needed)."""
    currency_lower = currency.lower()

    try:
        async with httpx.AsyncClient(timeout=10.0) as client:
            # Fetch current price and market data
            response = await client.get(
                "https://api.coingecko.com/api/v3/simple/price",
                params={
                    "ids": "bitcoin",
                    "vs_currencies": currency_lower,
                    "include_24hr_change": "true",
                    "include_24hr_vol": "true",
                    "include_market_cap": "true",
                    "include_24hr_high_low": "true"
                }
            )
            response.raise_for_status()
            data = response.json()["bitcoin"]

            current_price = data.get(currency_lower, 0)
            change_24h = data.get(f"{currency_lower}_24h_change", 0)
            volume_24h = data.get(f"{currency_lower}_24h_vol", 0)
            market_cap = data.get(f"{currency_lower}_market_cap", 0)
            high_24h = data.get(f"{currency_lower}_24h_high", current_price)
            low_24h = data.get(f"{currency_lower}_24h_low", current_price)

            return {
                "current_price": current_price,
                "change_24h": change_24h,
                "high_24h": high_24h,
                "low_24h": low_24h,
                "volume_24h": volume_24h,
                "market_cap": market_cap
            }
    except Exception as e:
        print(f"Error fetching Bitcoin data: {e}")
        # Fallback to mock data if API fails
        return {
            "current_price": 45234,
            "change_24h": 3.2,
            "high_24h": 46100,
            "low_24h": 43800,
            "volume_24h": 28500000000,
            "market_cap": 885000000000
        }

def generate_price_data(current_price: float):
    """Generate realistic Bitcoin price data for the chart based on current price."""
    prices = []
    base_price = current_price * 0.98  # Start slightly lower
    for i in range(24):
        variation_percent = random.uniform(-0.02, 0.02)  # ±2% variation
        base_price *= (1 + variation_percent)
        prices.append(round(base_price, 2))
    return prices

# FastMCP tool
@mcp.tool()
def show_bitcoin_price(currency: str = "USD") -> list[UIResource]:
    """Display Bitcoin price with live chart and statistics.

    Args:
        currency: Currency to display price in (default: USD)
    """
    # Point to the FastAPI endpoint in the same process
    iframe_url = f"http://localhost:8032/ui/bitcoin?currency={currency}"

    ui_resource = create_ui_resource({
        "uri": f"ui://bitcoin/{currency.lower()}",
        "content": {
            "type": "externalUrl",
            "iframeUrl": iframe_url,
        },
        "encoding": "text",
    })
    return [ui_resource]

# Create MCP HTTP app
mcp_app = mcp.http_app()

# Create main FastAPI application with lifespan management
app = FastAPI(title="Bitcoin Dashboard Server", lifespan=mcp_app.lifespan)

# Mount MCP server
app.mount("/mcp", mcp_app)

# FastAPI route: Render HTML
@app.get("/ui/bitcoin", response_class=HTMLResponse)
async def render_bitcoin_ui(currency: str = "USD"):
    """Render Bitcoin price dashboard with real live data from CoinGecko API."""
    # Fetch real Bitcoin data
    data = await fetch_bitcoin_data(currency)

    current_price = data["current_price"]
    change_24h = data["change_24h"]
    high_24h = data["high_24h"]
    low_24h = data["low_24h"]
    volume_24h = data["volume_24h"]
    market_cap = data["market_cap"]

    # Format numbers
    def format_large_number(num):
        """Format large numbers with B/M suffix."""
        if num >= 1_000_000_000:
            return f"{num / 1_000_000_000:.1f}B"
        elif num >= 1_000_000:
            return f"{num / 1_000_000:.1f}M"
        else:
            return f"{num:,.0f}"

    # Generate chart data based on current price
    price_history = generate_price_data(current_price)
    price_data_json = ",".join(map(str, price_history))

    # Currency symbol mapping
    currency_symbols = {
        "USD": "$", "EUR": "€", "GBP": "£", "JPY": "¥",
        "CNY": "¥", "KRW": "₩", "AUD": "A$", "CAD": "C$"
    }
    symbol = currency_symbols.get(currency.upper(), "$")

    # Load template and substitute values
    raw_html = load_html_template()
    template = Template(raw_html)
    rendered_html = template.safe_substitute(
        currency=currency.upper(),
        current_price=f"{symbol}{current_price:,.2f}",
        change_24h=f"+{change_24h:.2f}%" if change_24h > 0 else f"{change_24h:.2f}%",
        change_bg_color="bg-emerald-100" if change_24h > 0 else "bg-red-100",
        change_text_color="text-emerald-700" if change_24h > 0 else "text-red-700",
        high_24h=f"{symbol}{high_24h:,.2f}",
        low_24h=f"{symbol}{low_24h:,.2f}",
        volume=f"{symbol}{format_large_number(volume_24h)}",
        market_cap=f"{symbol}{format_large_number(market_cap)}",
        price_data=price_data_json
    )

    return HTMLResponse(content=rendered_html)

if __name__ == "__main__":
    print("🚀 Starting Bitcoin Dashboard Server")
    print("📊 MCP Endpoint: http://localhost:8032/mcp")
    print("🌐 Web UI: http://localhost:8032/ui/bitcoin")
    print("💡 Try: http://localhost:8032/ui/bitcoin?currency=EUR")
    print("📈 Data Source: CoinGecko API (real-time, free)")

    uvicorn.run(app, host="0.0.0.0", port=8032)
Server Code Explained
1. Fetching Real Bitcoin Dataasync def fetch_bitcoin_data(currency: str = "USD"): """Fetch real Bitcoin data from CoinGecko API"""
We use the free CoinGecko API to get:
- Current price in any currency (USD, EUR, GBP, etc.)
- 24-hour price change percentage
- 24-hour high and low
- Trading volume and market cap
The function includes error handling with fallback to mock data if the API is unavailable.
2. Generating Chart Datadef generate_price_data(current_price: float): """Generate realistic Bitcoin price data for the chart""" prices = [] base_price = current_price * 0.98 for i in range(24): variation_percent = random.uniform(-0.02, 0.02) base_price *= (1 + variation_percent) prices.append(round(base_price, 2)) return prices
This creates 24 data points for the hourly chart with realistic ±2% variations.
3. MCP Tool Returns iframe URL@mcp.tool() def show_bitcoin_price(currency: str = "USD") -> list[UIResource]: iframe_url = f"http://localhost:8033/ui/bitcoin?currency={currency}" ui_resource = create_ui_resource({ "content": { "type": "externalUrl", "iframeUrl": iframe_url, } }) return [ui_resource]
Note the type: "externalUrl" instead of "rawHtml"—this tells the client to load the URL in an iframe.
# Create MCP HTTP app
mcp_app = mcp.http_app()

# Create FastAPI with shared lifespan
app = FastAPI(lifespan=mcp_app.lifespan)

# Mount MCP server at /mcp
app.mount("/mcp", mcp_app)
This is the key to running both servers in one process:
mcp.http_app()converts FastMCP to an ASGI applicationlifespan=mcp_app.lifespanensures proper startup/shutdownapp.mount("/mcp", mcp_app)makes MCP available at/mcppath
@app.get("/ui/bitcoin", response_class=HTMLResponse)
async def render_bitcoin_ui(currency: str = "USD"):
    # Fetch data, format numbers, load template
    template = Template(raw_html)
    rendered_html = template.safe_substitute(
        current_price=f"{symbol}{current_price:,.2f}",
        price_data=price_data_json,
        # ... other variables
    )
    return HTMLResponse(content=rendered_html)
This endpoint:
- Fetches live Bitcoin data
- Formats numbers for display
- Generates chart data
- Loads the HTML template
- Injects data using Python's
Templateclass - Returns rendered HTML
Complete UI Code
Create a file called bitcoin-ui.html in the same directory:
<!DOCTYPE html>
<html lang="en">
<head>
    <meta charset="UTF-8">
    <meta name="viewport" content="width=device-width, initial-scale=1.0">
    <title>Bitcoin Dashboard</title>
    <script src="https://cdn.tailwindcss.com"></script>
    <script src="https://cdn.jsdelivr.net/npm/chart.js"></script>
</head>
<body class="bg-gradient-to-br from-slate-900 via-purple-900 to-slate-900 p-3">
    <div class="bg-white/95 backdrop-blur-sm rounded-xl shadow-2xl p-3 max-w-7xl mx-auto">
        <!-- Header Row -->
        <div class="flex items-center justify-between mb-2.5">
            <div class="flex items-center gap-2">
                <div class="w-8 h-8 bg-gradient-to-br from-orange-400 to-orange-600 rounded-full flex items-center justify-center text-white font-bold text-sm shadow-lg">
                    ₿
                </div>
                <div>
                    <h1 class="text-sm font-bold text-gray-900 leading-tight">Bitcoin</h1>
                    <p class="text-[10px] text-gray-500">BTC/$currency</p>
                </div>
            </div>
            <div class="text-right">
                <div class="text-2xl font-black text-gray-900 leading-tight">$current_price</div>
                <div class="inline-block mt-0.5 px-1.5 py-0.5 rounded text-[10px] font-semibold $change_bg_color $change_text_color">
                    $change_24h
                </div>
            </div>
        </div>

        <!-- Main Content Grid -->
        <div class="grid grid-cols-3 gap-2.5">
            <!-- Chart -->
            <div class="col-span-2 bg-gradient-to-br from-purple-50 to-blue-50 rounded-lg p-2.5 h-24">
                <canvas id="priceChart"></canvas>
            </div>

            <!-- Stats Grid -->
            <div class="grid grid-cols-2 gap-1.5">
                <div class="bg-gradient-to-br from-blue-50 to-cyan-50 rounded p-2">
                    <div class="text-[9px] text-gray-500 uppercase font-medium mb-0.5">High</div>
                    <div class="text-xs font-bold text-gray-900">$high_24h</div>
                </div>
                <div class="bg-gradient-to-br from-red-50 to-orange-50 rounded p-2">
                    <div class="text-[9px] text-gray-500 uppercase font-medium mb-0.5">Low</div>
                    <div class="text-xs font-bold text-gray-900">$low_24h</div>
                </div>
                <div class="bg-gradient-to-br from-green-50 to-emerald-50 rounded p-2">
                    <div class="text-[9px] text-gray-500 uppercase font-medium mb-0.5">Volume</div>
                    <div class="text-xs font-bold text-gray-900">$volume</div>
                </div>
                <div class="bg-gradient-to-br from-purple-50 to-pink-50 rounded p-2">
                    <div class="text-[9px] text-gray-500 uppercase font-medium mb-0.5">Cap</div>
                    <div class="text-xs font-bold text-gray-900">$market_cap</div>
                </div>
            </div>
        </div>
    </div>

    <script>
        const priceData = [$price_data];
        const labels = Array.from({length: 24}, (_, i) => (i % 6 === 0 ? i + 'h' : ''));

        const ctx = document.getElementById('priceChart').getContext('2d');
        const gradient = ctx.createLinearGradient(0, 0, 0, 90);
        gradient.addColorStop(0, 'rgba(139, 92, 246, 0.25)');
        gradient.addColorStop(1, 'rgba(139, 92, 246, 0.0)');

        new Chart(ctx, {
            type: 'line',
            data: {
                labels: labels,
                datasets: [{
                    data: priceData,
                    borderColor: '#8b5cf6',
                    backgroundColor: gradient,
                    borderWidth: 2,
                    tension: 0.4,
                    fill: true,
                    pointRadius: 0,
                    pointHoverRadius: 3,
                    pointHoverBackgroundColor: '#8b5cf6',
                    pointHoverBorderColor: '#fff',
                    pointHoverBorderWidth: 1.5
                }]
            },
            options: {
                responsive: true,
                maintainAspectRatio: false,
                plugins: {
                    legend: { display: false },
                    tooltip: {
                        mode: 'index',
                        intersect: false,
                        backgroundColor: 'rgba(0, 0, 0, 0.8)',
                        padding: 8,
                        titleFont: { size: 11 },
                        bodyFont: { size: 11 },
                        borderColor: '#8b5cf6',
                        borderWidth: 1,
                        callbacks: {
                            label: (context) => '$' + context.parsed.y.toLocaleString()
                        }
                    }
                },
                scales: {
                    y: { display: false },
                    x: {
                        grid: { display: false },
                        ticks: {
                            color: '#9ca3af',
                            font: { size: 8 }
                        }
                    }
                },
                interaction: {
                    mode: 'nearest',
                    axis: 'x',
                    intersect: false
                }
            }
        });
    </script>
</body>
</html>
UI Code Explained
1. Template VariablesNotice the $variable syntax throughout the HTML:
<div class="text-2xl font-black">$current_price</div>
<div class="$change_bg_color $change_text_color">$change_24h</div>
These are Python Template placeholders that get replaced with actual values at runtime.
The dashboard uses a professional gradient-based design:
- Card: Semi-transparent white with backdrop blur
- Bitcoin Icon: Orange gradient (₿ symbol)
- Stats Cards: Each has a unique gradient theme
- High: Blue → Cyan
- Low: Red → Orange
- Volume: Green → Emerald
- Market Cap: Purple → Pink
<div class="grid grid-cols-3 gap-2.5">
    <!-- Chart takes 2/3 width -->
    <div class="col-span-2">
        <canvas id="priceChart"></canvas>
    </div>

    <!-- Stats take 1/3 width in 2x2 grid -->
    <div class="grid grid-cols-2 gap-1.5">
        <!-- 4 stat cards -->
    </div>
</div>
This creates a responsive layout with the chart on the left and stats on the right.
4. Chart.js Integrationconst priceData = [$price_data]; // Injected from Python const labels = Array.from({length: 24}, (_, i) => (i % 6 === 0 ? i + 'h' : '')); new Chart(ctx, { type: 'line', data: { labels: labels, datasets: [{ data: priceData, borderColor: '#8b5cf6', // Purple line backgroundColor: gradient, // Gradient fill tension: 0.4, // Smooth curve // ... }] } });
The $price_data variable is replaced with a comma-separated list of numbers from Python, creating a smooth animated chart.
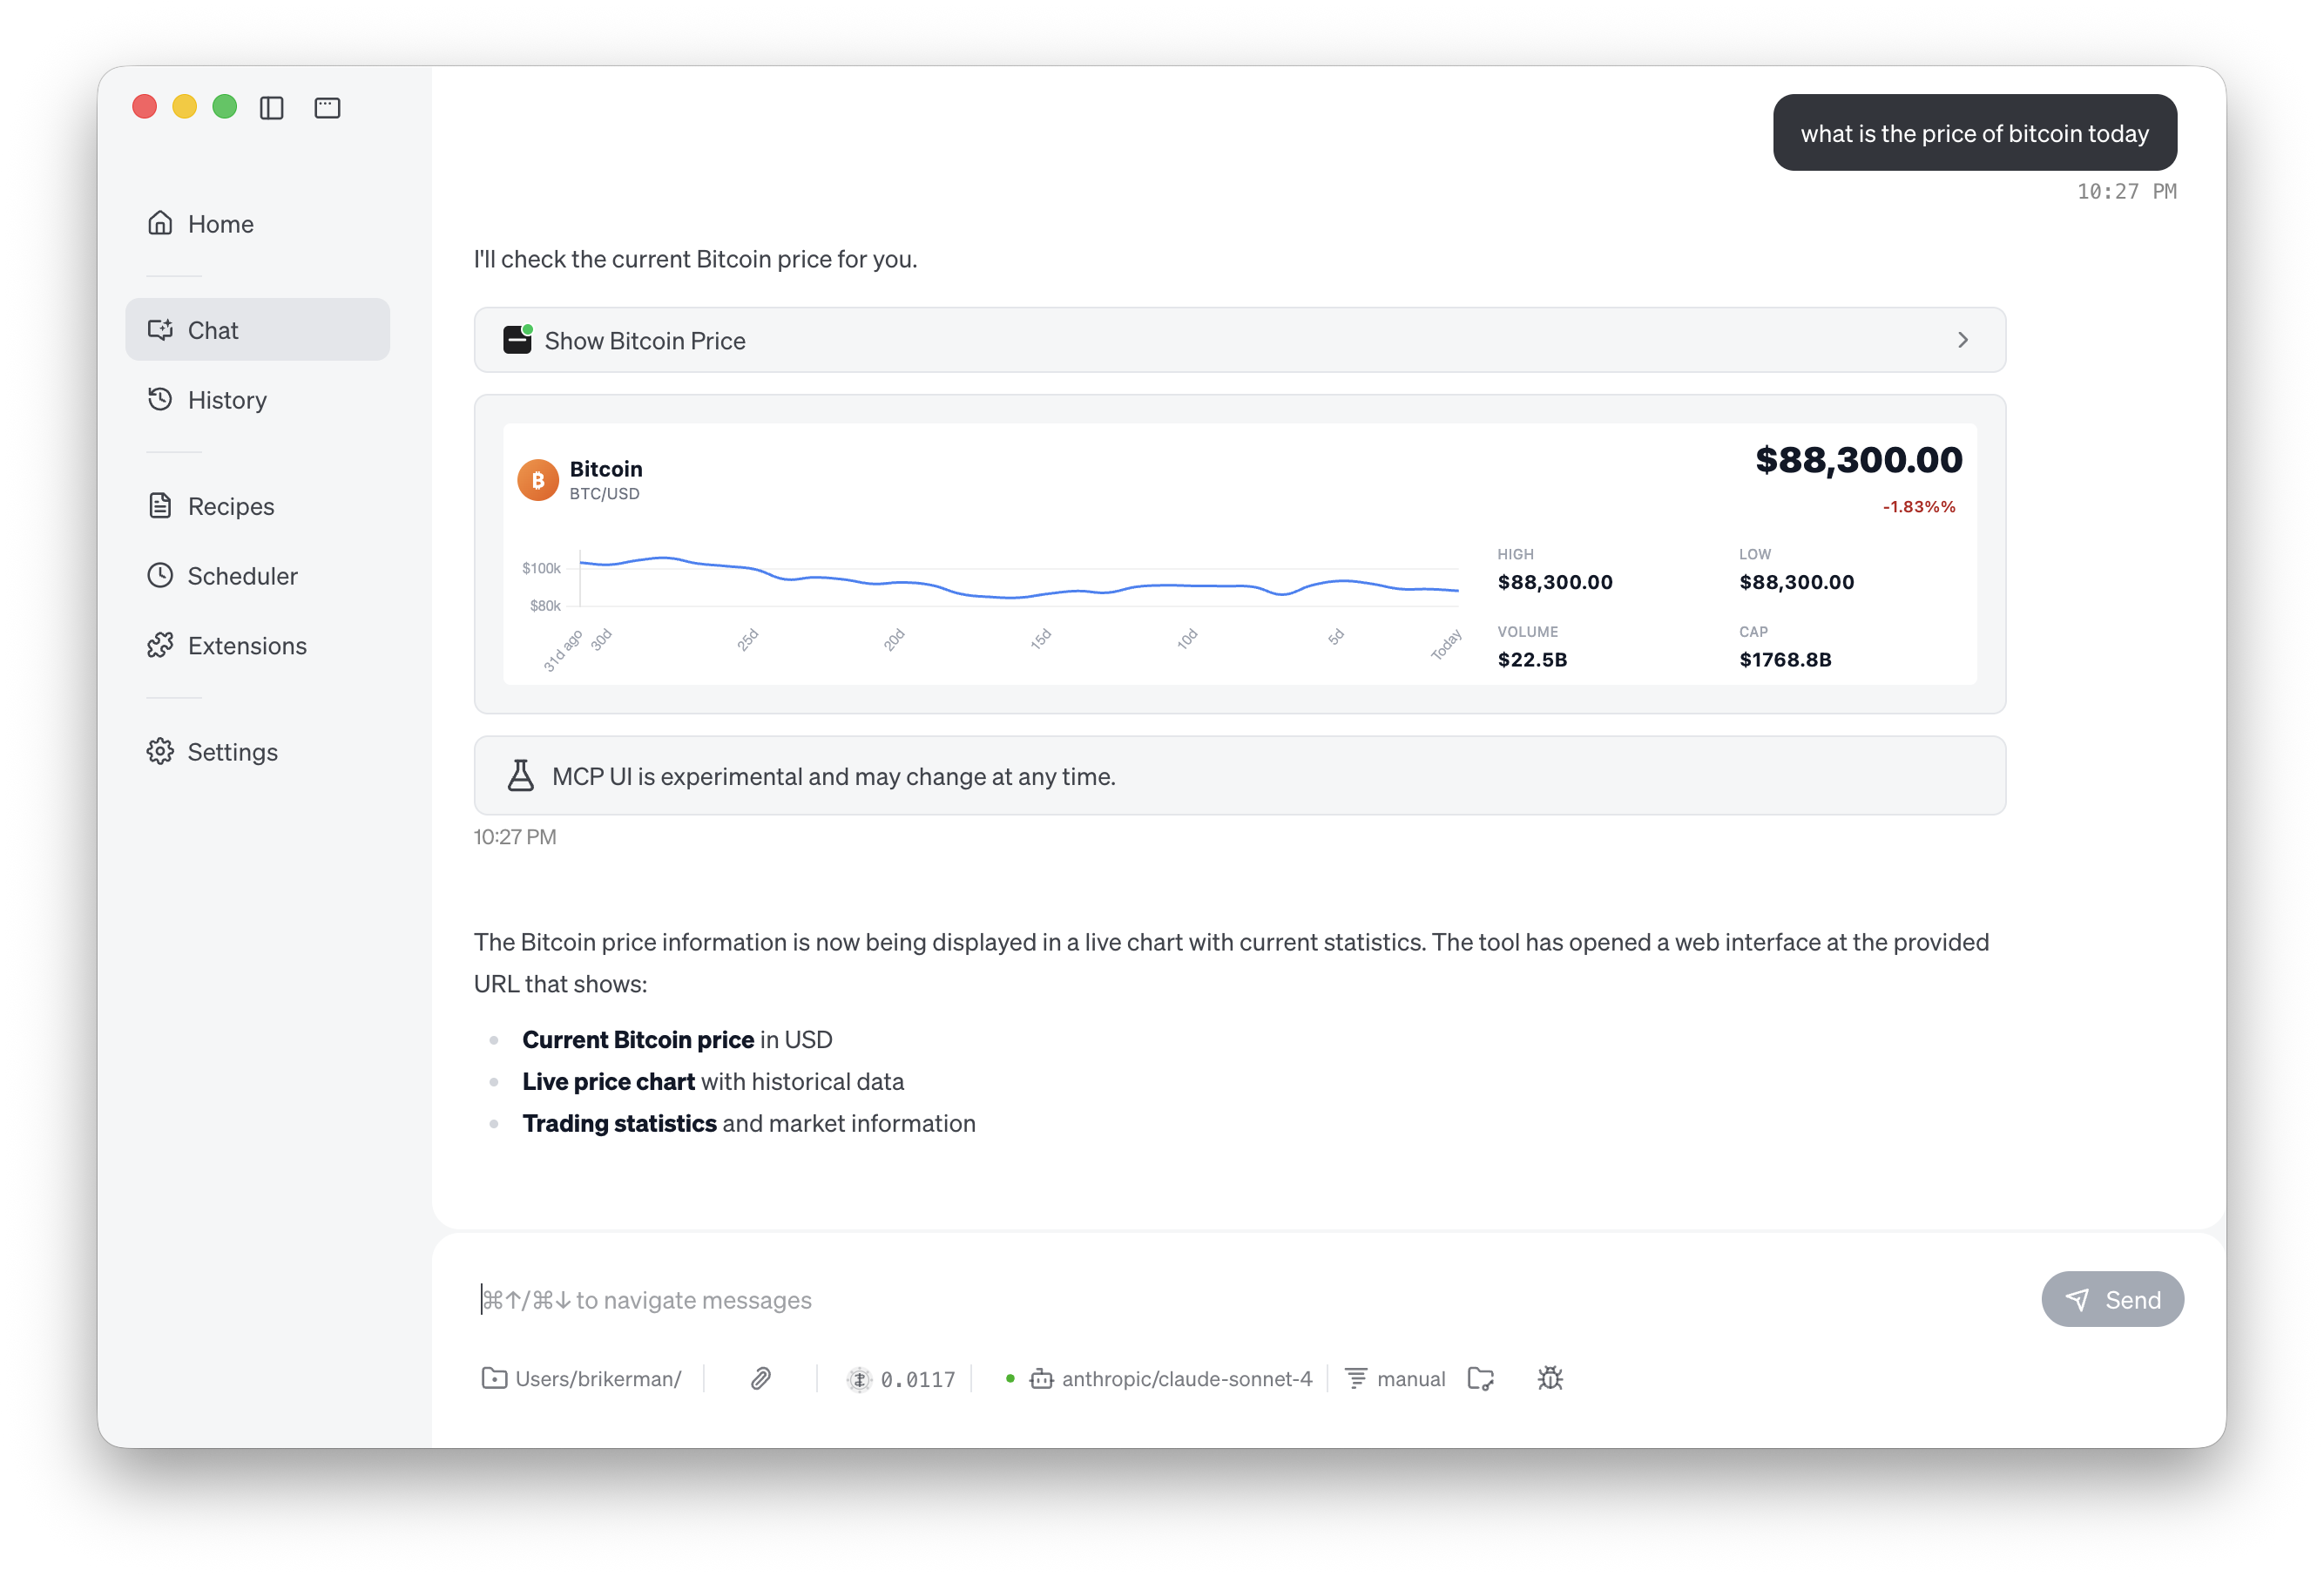
The dashboard is compact (~180px height) but information-rich:
- Large readable price
- Color-coded change indicator (green for up, red for down)
- Smooth chart with hover tooltips
- Four key metrics at a glance
Running Example 2
# From your mcp-app-demo directory
uv run demo-app-2.py

# You should see:
# 🚀 Starting Bitcoin Dashboard Server
# 📊 MCP Endpoint: http://localhost:8032/mcp
# 🌐 Web UI: http://localhost:8032/ui/bitcoin
# Open in browser
open http://localhost:8032/ui/bitcoin

# Try different currencies
open http://localhost:8032/ui/bitcoin?currency=EUR
open http://localhost:8032/ui/bitcoin?currency=GBP
open http://localhost:8032/ui/bitcoin?currency=JPY
Connecting to Goose Desktop
To connect Example 2 to Goose Desktop, use the same Extensions setup as Example 1, but with a different endpoint:
- Type: HTTP
- Endpoint:
http://127.0.0.1:8032/mcp
Now you can ask Goose Desktop to call show_bitcoin_price to see the dashboard.
Conclusion and Next Steps
Congratulations! You've learned how to build interactive UIs for AI agents using MCP Apps. Let's recap what we've covered:
What You've Learned
1.MCP Apps Fundamentals
- Server-side UI generation that works across multiple AI clients
- When to use MCP Apps vs AGUI
- Setting up a project from scratch with uv
2.Two Implementation Patterns
- rawHtml mode (Example 1): Quick, inline HTML for simple content
- iframe mode (Example 2): Separate HTML files with full JavaScript support
3.Real-World Integration
- Connecting to Goose Desktop with HTTP transport
- Fetching live data from external APIs
- Using modern web frameworks (Tailwind, Chart.js)
When to Use MCP Apps
Choose MCP Apps when you want to:
- Enhance existing tools with visual output (charts, tables, dashboards)
- Work with any MCP client (Goose Desktop, Claude Desktop, Nanobot, etc.)
- Focus on content rather than building custom UIs
- Leverage server-side logic for data processing and formatting
Choose AGUI or custom solutions when you need:
- A standalone AI application
- Deep control over the entire user experience
- Custom protocols or specialized interactions
Resources
Official Documentation: Host Platforms:- Goose Desktop - AI developer assistant
- Nanobot - Full MCP-UI support
- LibreChat - Open-source AI chat platform
- Chart.js - JavaScript charting library
- Tailwind CSS - Utility-first CSS framework
- CoinGecko API - Free cryptocurrency data